Single-GPU Training with PyTorch
This was adapted from Princeton University Multi-GPU Training with PyTorch
It is important to optimize your script for the single-GPU case before moving to multi-GPU training. This is because as you request more resources, your queue time increases. We also want to avoid wasting resources by running code that is not optimized.
Here we train a CNN on the MNIST dataset using a single GPU as an example. We profile the code and make performance improvements.
This tutorial uses PyTorch but the steps are similar for TensorFlow.
You can watch a video that covers everything on this page for single-GPU training with profiling Python using line_profiler, for the HPC system at Princeton. It will be a little different on the NYU HPC system because we'll be using overlay files, but it will give you a nice overview.
Step 1: Create a Working Directory
[NetID@log-1 ~]$ mkdir -p /scratch/NetID/pytorych_examples/pytorch_single_gpu
[NetID@log-1 ~]$ cd /scratch/NetID/pytorych_examples/pytorch_single_gpu
Step 2: Create PyTorch Overlay File
Please follow the instructions on Singularity with Conda to create a PyTorch overlay file in the working directory we created above. We will use this overlay file for the PyTorch examples to follow.
We also need to add the profiler kernprof (in the line_profiler package) to the overlay environment:
[NetID@log-1 ~]$ srun --pty -c 2 --mem=5GB /bin/bash
[NetID@cm001 ~]$ singularity exec \
	            --overlay /scratch/NetID/pytorch-example/my_pytorch.ext3:rw \
	            /scratch/work/public/singularity/cuda12.1.1-cudnn8.9.0-devel-ubuntu22.04.2.sif \
	            /bin/bash
Singularity> source /ext3/env.sh
Singularity> pip install line_profiler
Singularity> exit
[NetID@cm001 ~]$ exit
[NetID@log-1 ~]$
Stop 3: Get the Training Data
Save the following as the file download_data.py in your working directory:
import torchvision
import warnings
warnings.simplefilter("ignore")

# compute nodes do not have internet so download the data in advance

_ = torchvision.datasets.MNIST(root='data',
                               train=True,
                               transform=None,
                               target_transform=None,
                               download=True)
Let's first switch to a compute node, so we don't overly tax our login node:
[NetID@log-1 pytorch_single_gpu]$ srun --pty -c 2 --mem=5GB /bin/bash
This uses the torchvision package, so you'll need to run it with our overlay file:
[NetID@cm001 pytorch_single_gpu]$ singularity exec --nv --overlay /scratch/rjy1/pytorch-example/my_pytorch.ext3:ro /scratch/work/public/singularity/cuda12.1.1-cudnn8.9.0-devel-ubuntu22.04.2.sif /bin/bash -c "source /ext3/env.sh; python download_data.py"
After running the command above you should see that it has created a subdirectory named data that contains the data we'll use in this example.
Step 4: Run and Profile the Script
Please save the following code as mnist_classify.py:
# November 6, 2023
# https://github.com/pytorch/examples/blob/master/mnist/main.py

from __future__ import print_function
import argparse
import torch
import torch.nn as nn
import torch.nn.functional as F
import torch.optim as optim
from torchvision import datasets, transforms
from torch.optim.lr_scheduler import StepLR
from line_profiler import profile

class Net(nn.Module):
    def __init__(self):
        super(Net, self).__init__()
        self.conv1 = nn.Conv2d(1, 32, 3, 1)
        self.conv2 = nn.Conv2d(32, 64, 3, 1)
        self.dropout1 = nn.Dropout(0.25)
        self.dropout2 = nn.Dropout(0.5)
        self.fc1 = nn.Linear(9216, 128)
        self.fc2 = nn.Linear(128, 10)

    def forward(self, x):
        x = self.conv1(x)
        x = F.relu(x)
        x = self.conv2(x)
        x = F.relu(x)
        x = F.max_pool2d(x, 2)
        x = self.dropout1(x)
        x = torch.flatten(x, 1)
        x = self.fc1(x)
        x = F.relu(x)
        x = self.dropout2(x)
        x = self.fc2(x)
        output = F.log_softmax(x, dim=1)
        return output

@profile
def train(args, model, device, train_loader, optimizer, epoch):
    model.train()
    for batch_idx, (data, target) in enumerate(train_loader):
        data, target = data.to(device), target.to(device)
        optimizer.zero_grad()
        output = model(data)
        loss = F.nll_loss(output, target)
        loss.backward()
        optimizer.step()
        if batch_idx % args.log_interval == 0:
            print('Train Epoch: {} [{}/{} ({:.0f}%)]\tLoss: {:.6f}'.format(
                epoch, batch_idx * len(data), len(train_loader.dataset),
                100. * batch_idx / len(train_loader), loss.item()))
            if args.dry_run:
                break


def test(model, device, test_loader):
    model.eval()
    test_loss = 0
    correct = 0
    with torch.no_grad():
        for data, target in test_loader:
            data, target = data.to(device), target.to(device)
            output = model(data)
            test_loss += F.nll_loss(output, target, reduction='sum').item()  # sum up batch loss
            pred = output.argmax(dim=1, keepdim=True)  # get the index of the max log-probability
            correct += pred.eq(target.view_as(pred)).sum().item()

    test_loss /= len(test_loader.dataset)

    print('\nTest set: Average loss: {:.4f}, Accuracy: {}/{} ({:.0f}%)\n'.format(
        test_loss, correct, len(test_loader.dataset),
        100. * correct / len(test_loader.dataset)))


def main():
    # Training settings
    parser = argparse.ArgumentParser(description='PyTorch MNIST Example')
    parser.add_argument('--batch-size', type=int, default=64, metavar='N',
                        help='input batch size for training (default: 64)')
    parser.add_argument('--test-batch-size', type=int, default=1000, metavar='N',
                        help='input batch size for testing (default: 1000)')
    parser.add_argument('--epochs', type=int, default=14, metavar='N',
                        help='number of epochs to train (default: 14)')
    parser.add_argument('--lr', type=float, default=1.0, metavar='LR',
                        help='learning rate (default: 1.0)')
    parser.add_argument('--gamma', type=float, default=0.7, metavar='M',
                        help='Learning rate step gamma (default: 0.7)')
    parser.add_argument('--no-cuda', action='store_true', default=False,
                        help='disables CUDA training')
    parser.add_argument('--no-mps', action='store_true', default=False,
                        help='disables macOS GPU training')
    parser.add_argument('--dry-run', action='store_true', default=False,
                        help='quickly check a single pass')
    parser.add_argument('--seed', type=int, default=1, metavar='S',
                        help='random seed (default: 1)')
    parser.add_argument('--log-interval', type=int, default=10, metavar='N',
                        help='how many batches to wait before logging training status')
    parser.add_argument('--save-model', action='store_true', default=False,
                        help='For Saving the current Model')
    args = parser.parse_args()
    use_cuda = not args.no_cuda and torch.cuda.is_available()
    use_mps = not args.no_mps and torch.backends.mps.is_available()

    torch.manual_seed(args.seed)

    if use_cuda:
        device = torch.device("cuda")
    elif use_mps:
        device = torch.device("mps")
    else:
        device = torch.device("cpu")

    train_kwargs = {'batch_size': args.batch_size}
    test_kwargs = {'batch_size': args.test_batch_size}
    if use_cuda:
        cuda_kwargs = {'num_workers': 1,
                       'pin_memory': True,
                       'shuffle': True}
        train_kwargs.update(cuda_kwargs)
        test_kwargs.update(cuda_kwargs)

    transform=transforms.Compose([
        transforms.ToTensor(),
        transforms.Normalize((0.1307,), (0.3081,))
        ])
    dataset1 = datasets.MNIST('data/', train=True, download=False,
                       transform=transform)
    dataset2 = datasets.MNIST('data/', train=False,
                       transform=transform)
    train_loader = torch.utils.data.DataLoader(dataset1,**train_kwargs)
    test_loader = torch.utils.data.DataLoader(dataset2, **test_kwargs)

    model = Net().to(device)
    optimizer = optim.Adadelta(model.parameters(), lr=args.lr)

    scheduler = StepLR(optimizer, step_size=1, gamma=args.gamma)
    for epoch in range(1, args.epochs + 1):
        train(args, model, device, train_loader, optimizer, epoch)
        test(model, device, test_loader)
        scheduler.step()

    if args.save_model:
        torch.save(model.state_dict(), "mnist_cnn.pt")


if __name__ == '__main__':
    main()
To profile the training step, we have added the @profile decorator before the training function. This will profile the train function using line_profiler. kernprof is a profiler that wraps Python.
Please save the following Slurm script as single_gpu.slurm:
#!/bin/bash
#SBATCH --job-name=mnist         # create a short name for your job
#SBATCH --nodes=1                # node count
#SBATCH --ntasks=1               # total number of tasks across all nodes
#SBATCH --cpus-per-task=1        # cpu-cores per task (>1 if multi-threaded tasks)
#SBATCH --mem=8G                 # total memory per node (4 GB per cpu-core is default)
#SBATCH --gres=gpu:1             # number of gpus per node
#SBATCH --time=00:05:00          # total run time limit (HH:MM:SS)

# which gpu node was used
echo "Running on host" $(hostname)

# print the slurm environment variables sorted by name
printenv | grep -i slurm | sort

module purge

srun singularity exec --nv \
	    --overlay /scratch/NetID/pytorch-example/my_pytorch.ext3:ro \
	    /scratch/work/public/singularity/cuda12.1.1-cudnn8.9.0-devel-ubuntu22.04.2.sif\
	    /bin/bash -c "source /ext3/env.sh; kernprof -o ${SLURM_JOBID}.lprof -l mnist_classify.py --epochs=3"
Finally, submit the job while specifying the reservation:
[NetID@log-1 pytorch_single_gpu]$ sbatch single_gpu.slurm
You should find that the code runs in about 20-40 seconds with 1 CPU-core depending on which GPU node was used:
$ seff 1937315
Job ID: 1937315
Cluster: adroit
User/Group: aturing/cses
State: COMPLETED (exit code 0)
Cores: 1
CPU Utilized: 00:00:36
CPU Efficiency: 94.74% of 00:00:38 core-walltime
Job Wall-clock time: 00:00:38
Memory Utilized: 593.32 MB
Memory Efficiency: 7.24% of 8.00 GB
Some variation in the run time is expected when multiple users are running on the same node.
Step 5: Analyze the Profiling Data
We installed line_profiler into the Conda environment and profiled the code. To analyze the profiling data:
[NetID@log-1 ~]$ srun --pty -c 2 --mem=5GB /bin/bash
[NetID@cm001 ~]$ singularity exec \
	            --overlay /scratch/NetID/pytorch-example/my_pytorch.ext3:rw \
	            /scratch/work/public/singularity/cuda12.1.1-cudnn8.9.0-devel-ubuntu22.04.2.sif \
	            /bin/bash -c "source /ext3/env.sh; python -m line_profiler -rmt *.lprof"
Timer unit: 1e-06 s

Total time: 30.8937 s
File: mnist_classify.py
Function: train at line 39

Line #      Hits         Time  Per Hit   % Time  Line Contents
==============================================================
    39                                           @profile
    40                                           def train(args, model, device, train_loader, optimizer, epoch):
    41         3        213.1     71.0      0.0      model.train()
    42      2817   26106124.7   9267.3     84.5      for batch_idx, (data, target) in enumerate(train_loader):
    43      2814     286242.0    101.7      0.9          data, target = data.to(device), target.to(device)
    44      2814     296440.2    105.3      1.0          optimizer.zero_grad()
    45      2814    1189206.1    422.6      3.8          output = model(data)
    46      2814      81578.6     29.0      0.3          loss = F.nll_loss(output, target)
    47      2814    1979990.2    703.6      6.4          loss.backward()
    48      2814     841861.9    299.2      2.7          optimizer.step()
    49      2814       2095.3      0.7      0.0          if batch_idx % args.log_interval == 0:
    50       564       1852.9      3.3      0.0              print('Train Epoch: {} [{}/{} ({:.0f}%)]\tLoss: {:.6f}'.format(
    51       282       2218.6      7.9      0.0                  epoch, batch_idx * len(data), len(train_loader.dataset),
    52       282     105753.3    375.0      0.3                  100. * batch_idx / len(train_loader), loss.item()))
    53       282        119.2      0.4      0.0              if args.dry_run:
    54                                                           break

 30.89 seconds - mnist_classify.py:39 - train
The slowest line is number 42 which consumes 84.5% of the time in the training function. That line involves train_loader which is the data loader for the training set. Are you surprised that the data loader is the slowest step and not the forward pass or calculation of the gradients? Can we improve on this?
Examine Your GPU Utilization
Note that GPU utilization as measured using nvidia-smi is only a measure of the fraction of the time that a GPU kernel is running on the GPU. It says nothing about how many CUDA cores are being used or how efficiently the GPU kernels have been written. However, for codes used by large communities, one can generally associate GPU utilization with overall GPU efficiency. For a more accurate measure of GPU utilization, use Nsight Systems or Nsight Compute to measure the occupancy.
Step 6: Work through the Performance Tuning Guide from Princeton
Make sure you optimize the single GPU case before going to multiple GPUs by working through the Performance Tuning Guide.
Step 7: Optimize Your Script
One technique that was discussed in the Princeton Performance Tuning Guide was using multiple CPU-cores to speed-up ETL. Let's put this into practice.
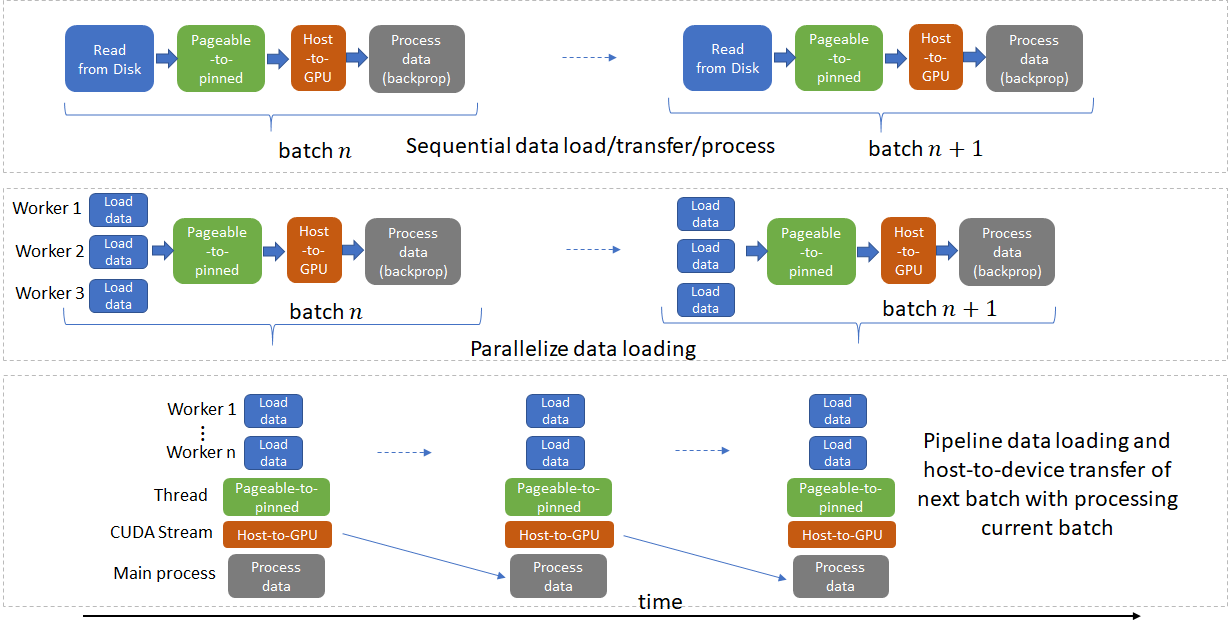
Credit for image above is here.
In mnist_classify.py, change num_workers from 1 to 8. And then in single_gpu.slurm change --cpus-per-task from 1 to 8. Then run the script again and note the speed-up:
[NetID@log-1 pytorch_single_gpu]$ sbatch job.slurm
How did the profiling data change? Watch the video for the solution. For consistency between the Slurm script and PyTorch script, one can use:
import os
...
    cuda_kwargs = {'num_workers': int(os.environ["SLURM_CPUS_PER_TASK"]),
...
Several environment variables are set in the Slurm script. These can be referenced by the PyTorch script as demonstrated above. To see all of the available environment variables that are set in the Slurm script, add this line to job.slurm:
printenv | sort
Consider these external data loading libraries: ffcv and NVIDIA DALI.
Summary
It is essential to optimize your code before going to multi-GPU training since the inefficiencies will only be magnified otherwise. The more GPUs you request in a Slurm job, the longer you will wait for the job to run. If you can get your work done using an optimized script running on a single GPU then proceed that way. Do not use multiple GPUs if your GPU efficiency is low. Jobs with low GPU efficiency may be terminated.
Next, we focus on scaling the code to multiple GPUs.